dockertop: htop for your containers
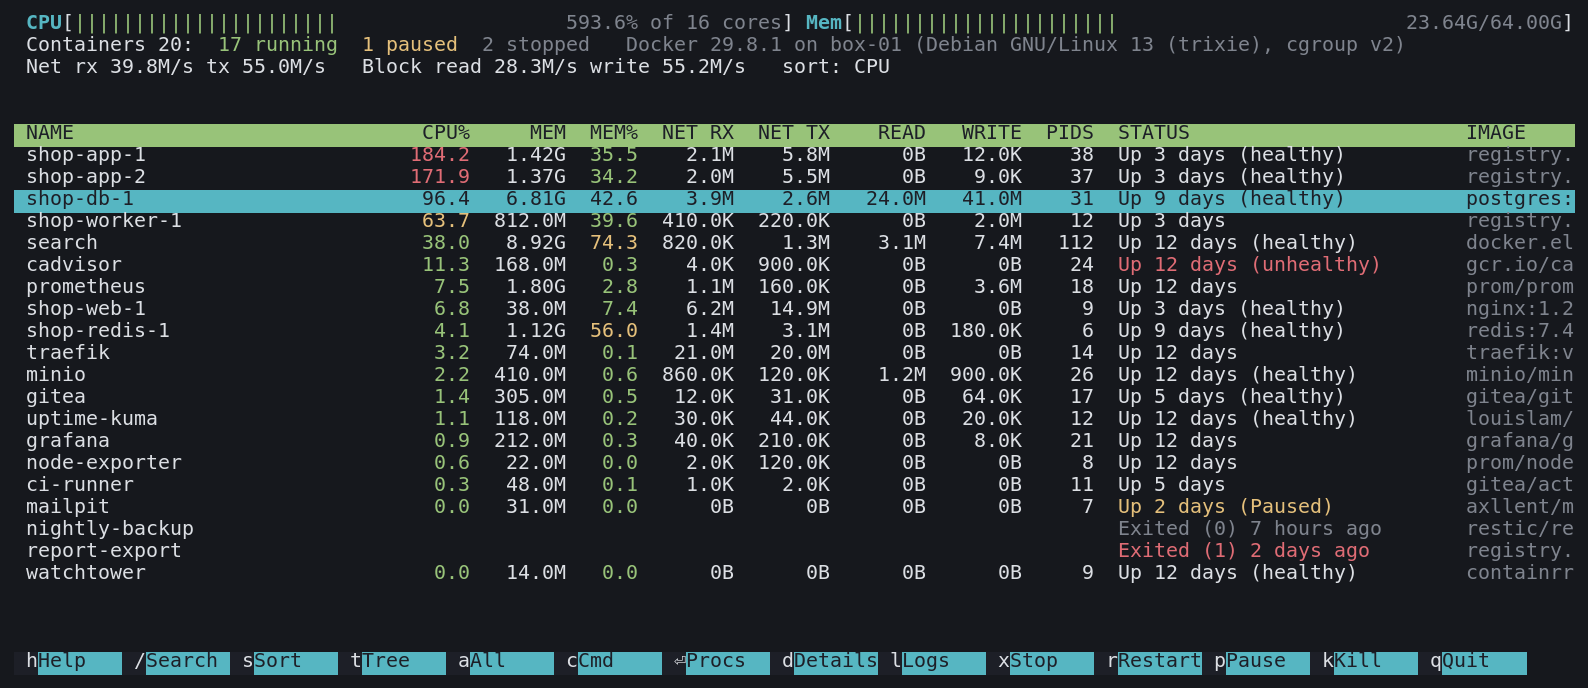
A htop-style monitor for Docker. docker stats gives you a wall of numbers that scrolls away, and docker top gives you a snapshot of ps. dockertop puts every container on one screen with its CPU, memory, network and disk I/O, groups them by compose project, and lets you press Enter on any of them to get a proper htop of the processes inside. Logs, details, stop, restart, pause and signals are a key away.
- Go
- Terminal UI
- Docker
- Linux
- Open source
Role:
Sole designer & engineer
Stack:
Go, tcell, Docker Engine API, one static binary
Status:
v1.0.0, GPLv3, on Homebrew, apt and dnf
Install
With Homebrew on Linux, it is one line:
brew install andydixon/tap/dockertopThat builds it from source, puts dockertop on your path and installs the manual page, so man dockertop works straight away. brew upgrade picks up new releases.
Then run it as anyone who can reach the Docker socket:
dockertop                 # every container
dockertop -t -r           # grouped by compose project, running only
dockertop shop-db-1       # straight into one container's processes
dockertop -s MEM -d 1     # sort by memory, refresh every second
From my package repository
On Debian, Ubuntu, Fedora, RHEL, openSUSE or Arch, add repo.dixon.cx once and install dockertop with apt, dnf, zypper or pacman. It's signed, and updates arrive with the rest of your system.
# Debian, Ubuntu
sudo apt install dockertop

# Fedora, RHEL, AlmaLinux, Rocky
sudo dnf install dockertop
Packages are built for x86-64, ARM64, ARMv7, 32-bit x86 and RISC-V.
From source
go install github.com/andydixon/dockertop@latestdockertop talks to the Docker Engine API over the socket, so it doesn't need the docker command. It needs Linux for the process view, because that reads /proc on the host.
The itch
A host with forty containers gets slow. docker stats shows a table that redraws every second, can't be sorted or searched, and stops at the container. When you find the one using four cores, the next step is docker top, which shows ps output with lifetime CPU averages, or docker exec into it and hope the image has top installed. Most slim images don't.
I wanted the whole path on one screen, laid out like htop so there is nothing new to learn: which container, then which process in it, then what it's logging, then do something about it.
Grouped by compose project
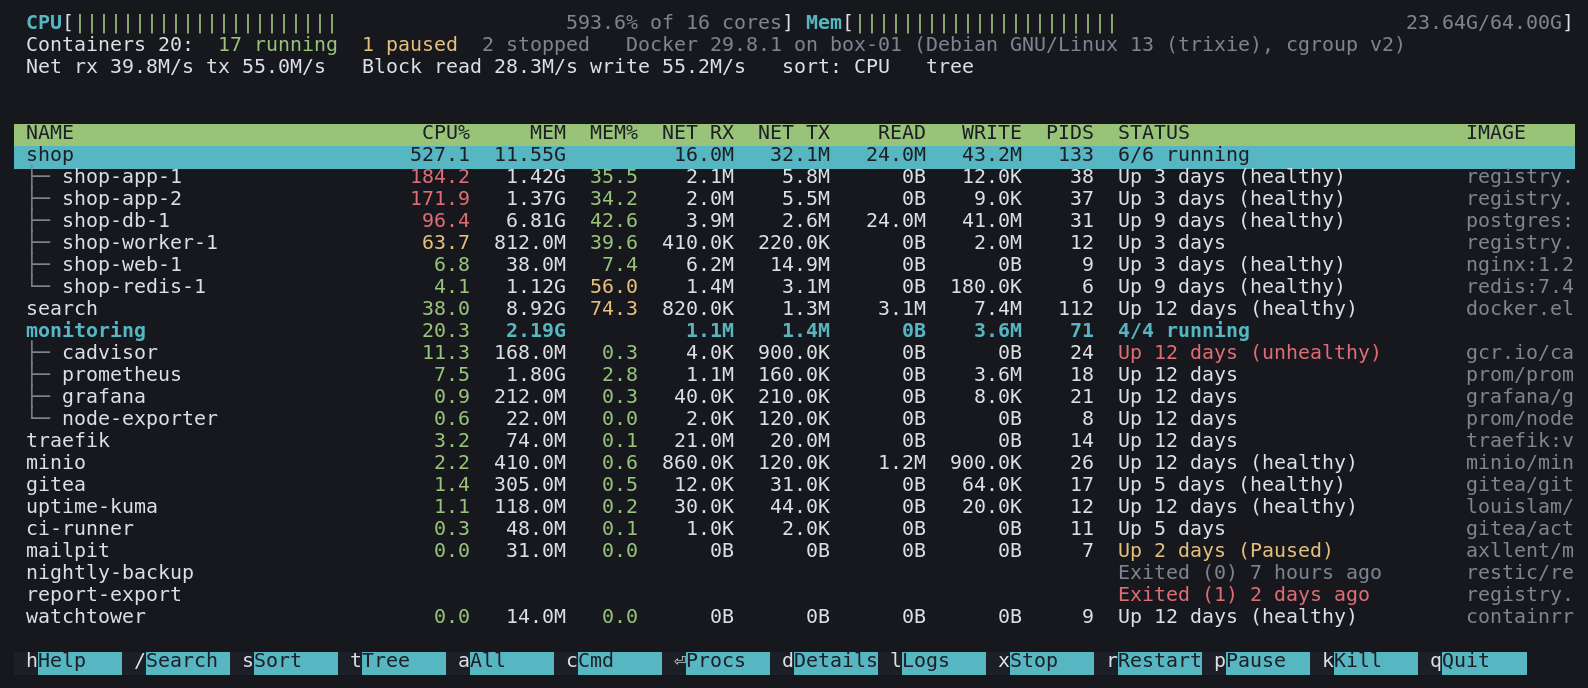
Press t and containers sit under their compose project, with a summary row adding up the project's CPU, memory, I/O and processes, and how many of its containers are running. A stack of six services reads as one thing, and the noisy project floats to the top.
An htop inside every container
Press Enter on a container and you get its processes, with the columns htop has: PID, user, priority, nice, virtual and resident size, state, CPU, memory, CPU time and command. CPU is measured over the last refresh, not averaged over the process's life. Memory is shown against the container's own limit, because that is the number the OOM killer will use. The header shows the container's CPU against its CPU limit, memory against its memory limit, tasks, threads and uptime.
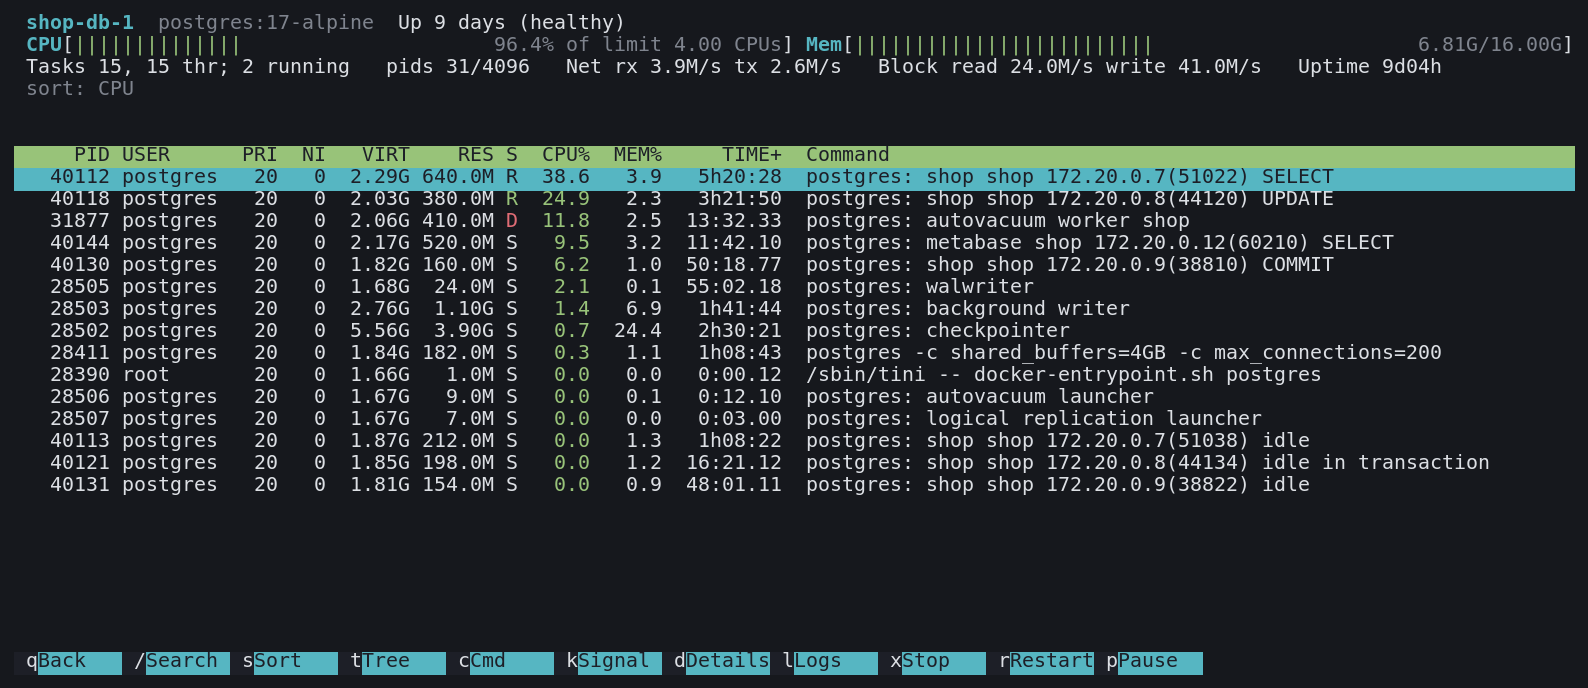
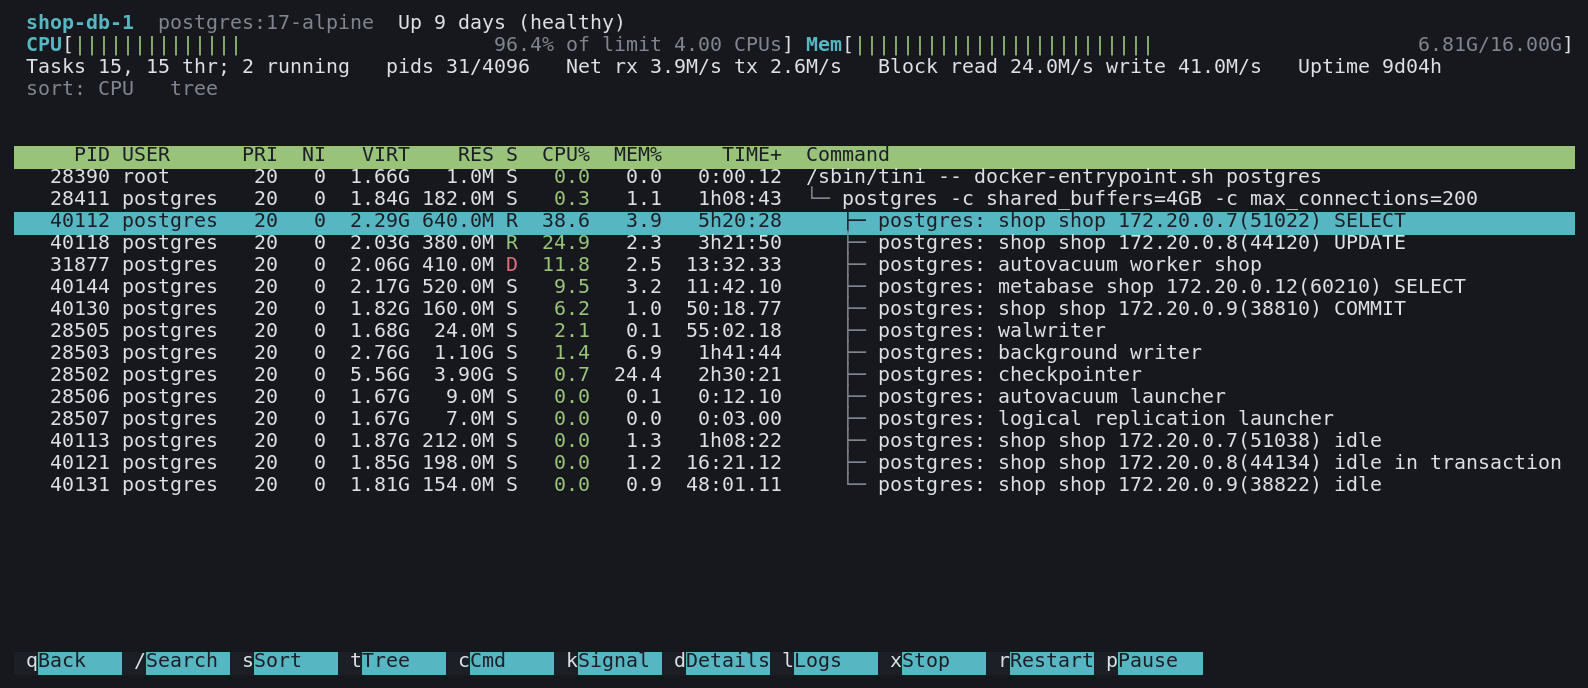
It works in images that have no shell, no ps and no top, because nothing runs inside the container. The daemon says which host processes belong to it, and dockertop reads them from the host's /proc. User names come from the container's own /etc/passwd, since the host's names are wrong for container UIDs. t shows the process tree:
Details and logs
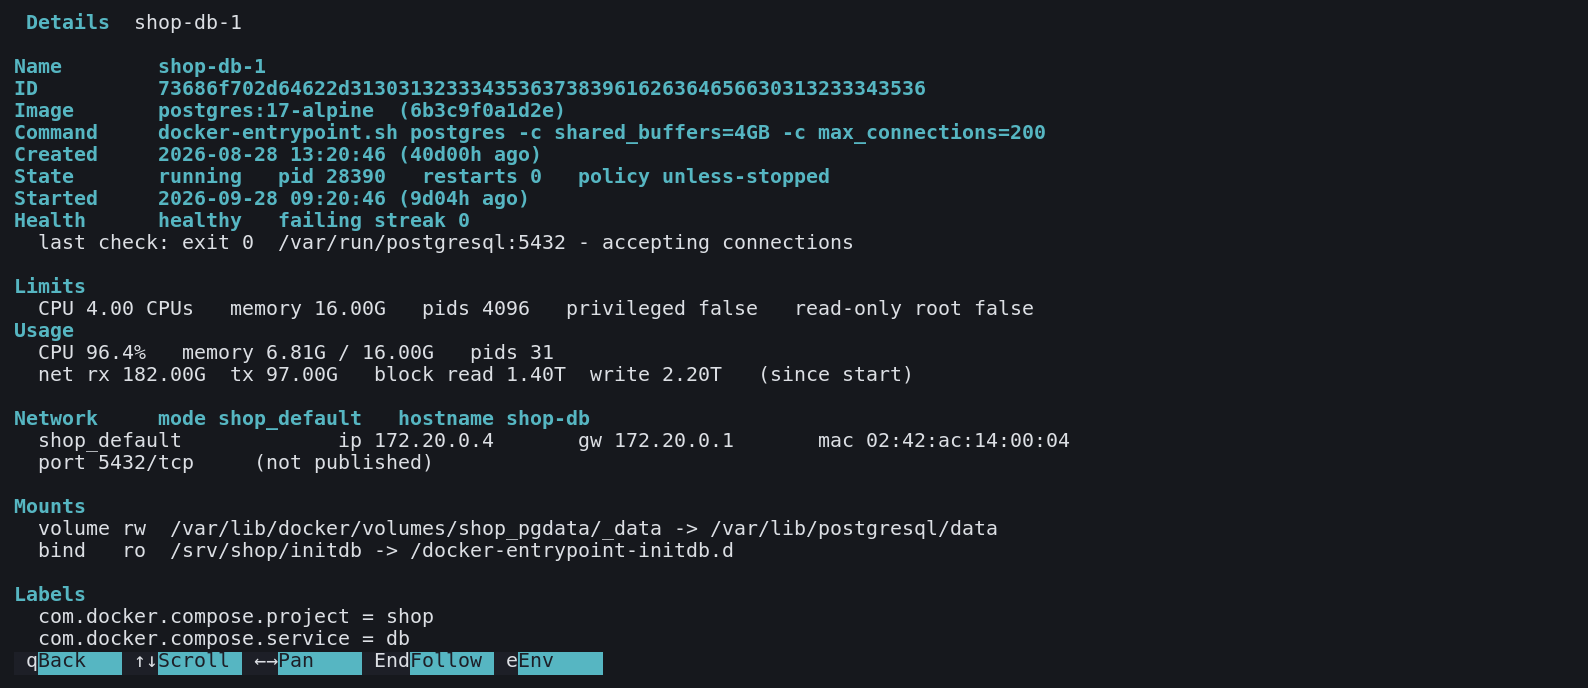
d shows what you would otherwise dig out of docker inspect: image, command, state, restart policy, the last health check and its output, limits, current usage and totals since start, networks, published ports, mounts and labels. Environment variables are hidden until you press e, because they so often hold passwords and you may be sharing your screen.
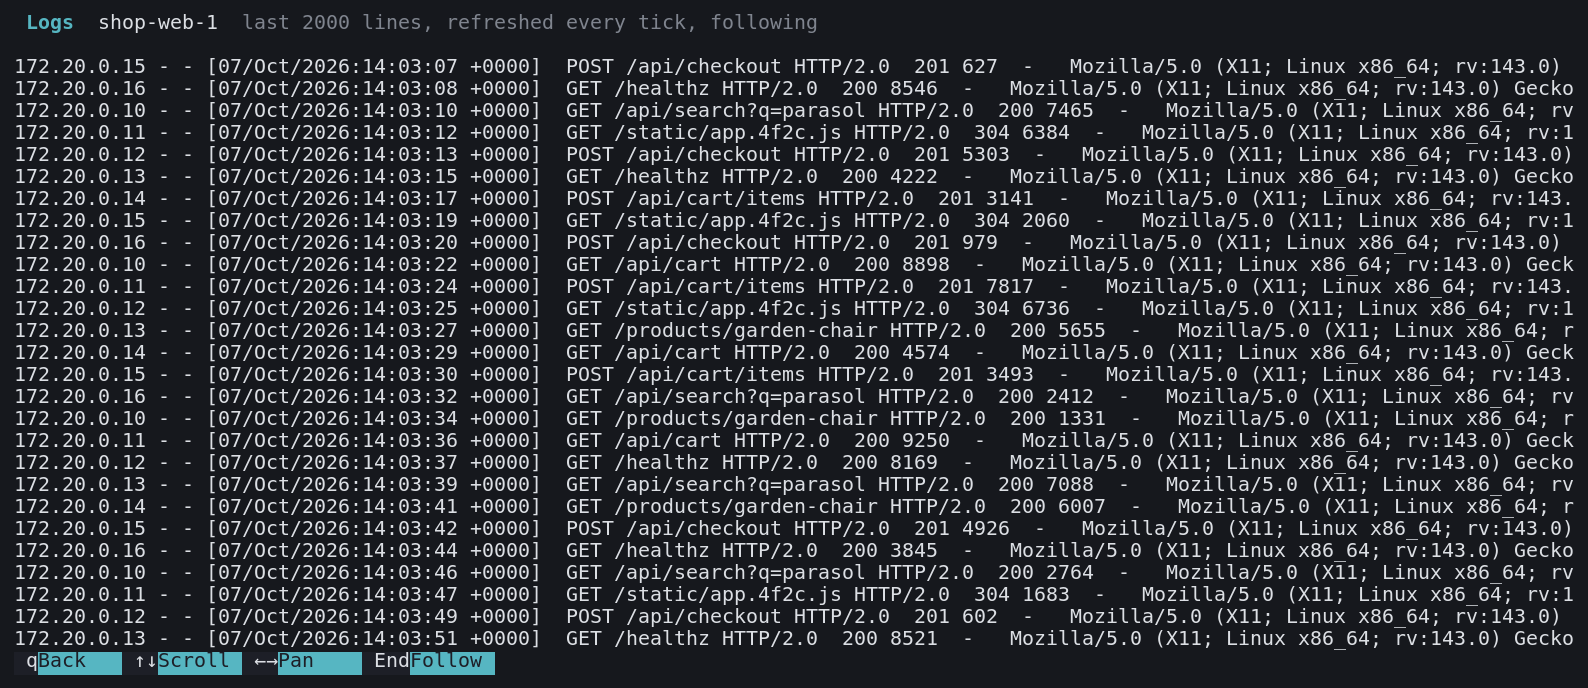
l shows the last 2000 lines of the log and follows new lines as they arrive. Scroll up to stop following, press End to carry on, and Left and Right to read long lines.
Doing something about it
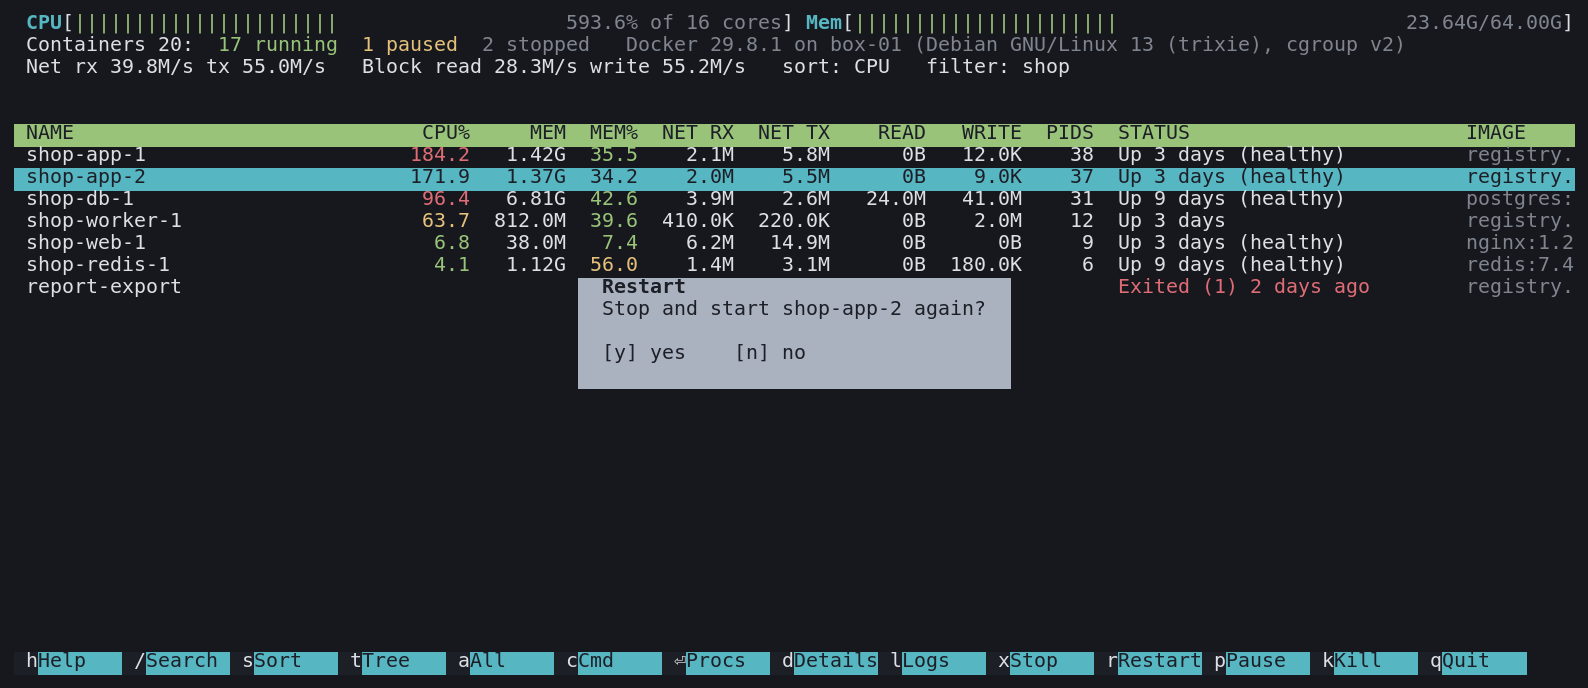
Every action asks first, and says what it is about to do.
- Stop or start (
x): stops a running container the waydocker stopdoes, TERM then KILL after the timeout, or starts a stopped one. - Restart (
r): stops and starts it. - Pause (
p): freezes every process in the container with the cgroup freezer, or thaws it. Handy for stopping a runaway job without losing its state. - Signal (
k): a picker for TERM, KILL, INT, HUP, QUIT, USR1, USR2, STOP and CONT. In the list it goes to the container's main process; in the process view it goes to the one process you have selected, so you can HUP one worker or kill one stuck query.
Keys
Plain letters, the same ones as in swaptop wherever they mean the same thing. h shows them all.
| Key | What it does |
|---|---|
Enter | Processes inside the selected container |
d l | Details, logs |
/ | Search by name, ID, image, project or status; in the process view by command, user or PID |
s | Cycle the sort column: CPU, MEM, NET, IO, PIDS, NAME, IMAGE, STATE |
t | Group by compose project, or the process tree |
a | Show stopped containers, or running ones only |
c | Image or command; process name or full command line |
x r p k | Stop or start, restart, pause, send a signal |
h q | Help, back or quit |
Your choices of sort, grouping, tree view and refresh rate are saved to ~/.config/dockertop/config when you quit, and the command-line flags override them for one run.
The screenshots show a made-up server I generated for the purpose, not a real machine.
Engineering decisions
- Same numbers as Docker: container CPU and memory come from the daemon's own statistics, with memory counted the way
docker statscounts it, minus page cache the kernel can drop. If the two tools disagree, one of them has a bug. - Nothing inside the container: the process view never execs into the container, so it works on distroless and scratch images and can't disturb what is running. Each PID is checked against the container's cgroup before it is trusted.
- No dependency on the CLI: it speaks the Engine API over the socket with Go's standard HTTP client. Statistics for every container are fetched in parallel in the background, so the screen never waits on a slow daemon.
- Honest when it can't see: pointed at a remote daemon, the host PIDs aren't in the local
/proc. dockertop says so and shows the daemon's ownpsoutput, labelled as lifetime averages, rather than wrong numbers. - Careful with secrets: environment variables stay hidden until you ask, and every lifecycle action needs a yes.
- Tested against a live box: I built it against a host running seventy containers, and checked every view and the confirmation prompts there. The screenshots use made-up data so that host stays private.
What it demonstrates
Containers seen from both sides: the Docker Engine API for what the daemon knows, and the kernel's process accounting for what is actually running, joined through cgroups. It drives both from a terminal interface with the same affordances people already know from htop, and ships as one binary with a manual page, packages for five architectures and a Homebrew formula.